Performance vs. Profitability: CFO’s Guide to Measuring ROI
As a CFO, you play a critical role in guiding your company's strategic decisions and investments. However, with countless initiatives competing for limited resources, determining where to allocate funds can be a significant challenge.

While some options promise improved business performance, others offer more direct profitability gains.
So how do you compare returns across diverse investments to make informed choices? This article helps CFOs see if an investment is worthwhile, by measuring ROI and looking at both how well it works and how much money it makes.
Defining key metrics
To set the stage, let’s clarify two central concepts – performance and profitability:
Performance encompasses functional metrics like market share, customer satisfaction, production efficiency, and other factors tied to the execution of business processes. Performance initiatives aim to strengthen the capabilities, speed, or quality of our rival competitors.
Profitability measures net earnings, margins, returns, and other indicators of financial health and growth. Profitability initiatives directly expand profits by reducing expenses or increasing revenue.
While connected, these represent distinct assessment dimensions for investment options. We’ll explore their unique merits shortly. First, understanding why a balanced approach is essential.

The measuring roi dilemma
As stewards of financial resources, CFOs must evaluate potential returns to recommend allocations best aligned with corporate strategy. However, not all returns manifest as direct profit flows. Initiatives driving performance gains confer strategic advantages – like increased customer loyalty – that translate to net income over longer timeframes.
Conversely, pursuits advancing near-term profitability may compromise capabilities that underpin future success. Cutting vital infrastructure or human capital to trim expenses risks hobbling long-run competition.
This tension creates a dilemma – how do CFOs compare ROI calculation across investments with complex returns spanning different periods? Examining performance and profitability dimensions individually provides clearer insights.
Performance vs. Profitability
Let’s break down key elements of performance and profitability measures to better understand their distinct outputs.
Sizing Up performance
Performance metrics quantify productive execution, efficiency, and market outcomes. Common examples include:
- Market share – percentage of total sales volume in a sector
- Customer satisfaction – feedback scores and retention rates
- Cycle times – speed of processes like order fulfilment
- Quality – defect rates and benchmarked ratings
- Capacity use – the percentage of potential output realised
While not direct total revenue sources, these provide leading indicators of financial trajectory. Gains in these areas suggest future earnings growth, while decline flags nascent troubles.
As such, performance initiatives lay strategic foundations for enduring success. For example:

- Expanding capacity
- Streamlining production workflows
- Launching customer loyalty programs
- Improving product or service quality controls
The payoff from these efforts accumulates over time – an essential context for properly evaluating return on investment (ROI).
Profitability’s bottom-line focus
On the other hand, profitability metrics offer a clear company financial lens. Key examples include:
- Revenue & sales growth
- Gross profit margin/Net margins – percentage of revenue retained as profit
- Earnings per share
- Return on total assets/equity – earnings relative to capital invested
These directly quantify financial vitality. As such, initiatives targeting profitability promise more immediate returns by either:
Increasing revenues through higher prices or sales volume. For example:
- Introducing premium products or services
- Entering new regional markets
- Licensing intellectual property
Reducing expenses via structural changes like:
- Workforce downsizing
- Revisiting supplier contracts
- Exiting unproductive business lines
The fruits of these efforts manifest on income statements and balance sheets – crucial measures for investors. However, the myopic pursuit of bottom-line gains risks eroding foundational performance capacities.
Contrasting outcomes
Let’s examine a scenario highlighting the distinct outcomes of performance-driven and profitability-focused initiatives:
Context
- Company X operates retail stores selling household appliances
- Facing margin pressure from online discount retailers
Performance initiative
- Invest in sales staff training to improve customer service
Outcomes
- Higher customer satisfaction scores
- Increased customer loyalty and repeat purchases
- Gradual revenue growth over 2-3 years
Profitability initiative
- Cut production staff to reduce labour costs
Outcomes
- Lower operating expenses
- Increased net profit margin in Year 1
- Higher executive bonuses
Trade-offs
- Slower production times
- Declining product quality
- Poor customer service ratings
While the profitability effort provided an immediate financial lift, the resultant performance degradation would likely diminish revenues over time as customers shift to competitors.
This example highlights the inherent tensions between maximising current returns versus investing in future positioning. As stewards of long-term success, leadership must strike the right balance between the two.
Measuring ROI: A balanced scorecard approach
So how should CFOs calculate the ROI across diverse initiatives to inform smart investment decisions? An effective framework requires assessing both financial returns and performance impacts.
Here we introduce a balanced scorecard method to quantify ROI from multiple vantage points.
Balanced scorecards for strategic clarity
Pioneered by Drs. Robert Kaplan and David Norton, balanced scorecards supplement financial metrics with key performance indicators (KPIs) spanning four perspectives:
- Financial – earnings, profitability, growth
- Customer – satisfaction, loyalty, market position
- Internal process – quality, efficiency, cycle times
- Learning & growth – human, technology, and information capabilities
This creates a comprehensive snapshot of organisational health and strategy execution. Rather than overstating singular financial returns, the balanced framework recognises vital non-financial factors that enable enduring profitability.
Comprehensive insight for informed decisions
Armed with a balanced scorecard, CFOs can evaluate potential ROI more rigorously before determining the cost of the investment allocations.
Key evaluation elements
Financial returns
- Upfront and ongoing costs
- Revenue and margin projections
- Forecasted cash flows
Business Impact
- Striving, market share
- Customer indicators
- Brand perception
Risk factors
- Prospects of achieving projections
- Large-scale variables
- Competitor responses
Strategic alignment
- Consistency with core capabilities
- Fit with growth objectives
- Resource requirements
This provides clarity on the likelihood and magnitude of financial returns while also weighing competitive positioning impacts.
Putting it all together
Let’s see the framework in action through a case study:
Context
Pharma Company A develops patented drugs for niche medical conditions. Leadership is exploring two growth options:
- Initiative 1: Invest in manufacturing upgrades to increase production capacity by 30%
- Initiative 2: Acquire a clinical-stage biotech firm with a promising drug pipeline
Balanced scorecard insight
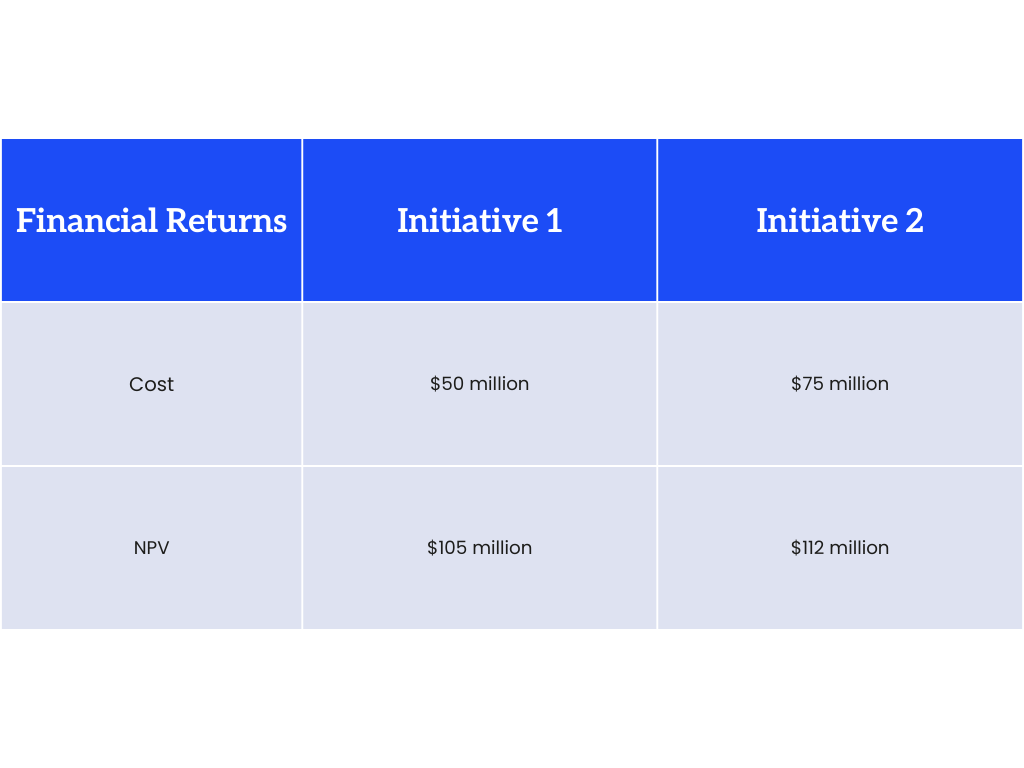
Favours Initiative 2 for higher NPV
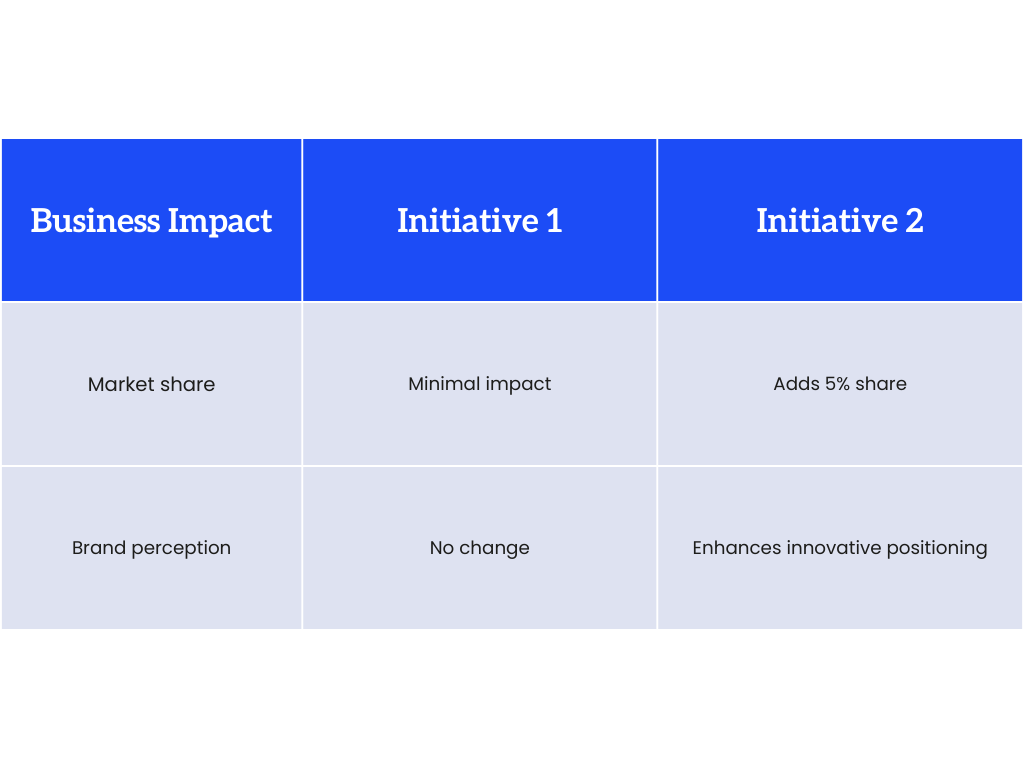
Favors Initiative 2 for competitive positioning gains
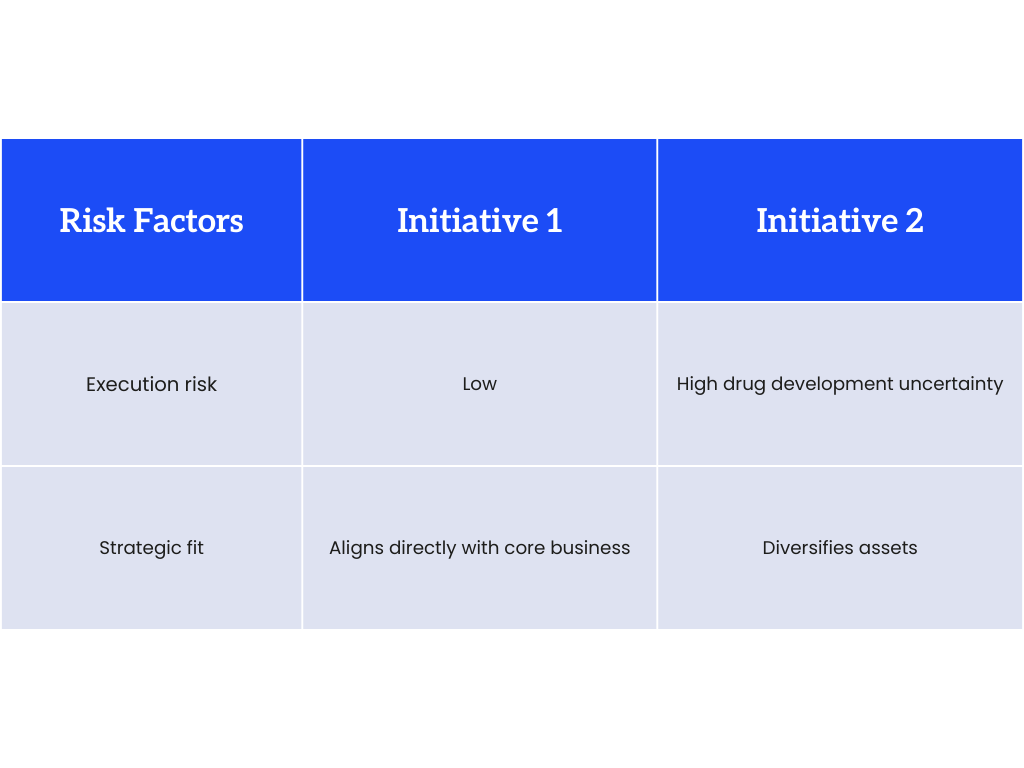
Initiative 1 lower risk overall
Decision rationale
Despite higher financial returns potential, Initiative 2 carries significantly more risk. Initiative 1 supports existing capabilities with a strong certainty of returns. Lower risk and strategic harmony make it the better investment choice.
This evaluation integrated both profitability projections and performance considerations across key dimensions – spotlighting insights not accessible from an isolated financial lens.
To navigate this tightrope, CFOs need a robust decision-making framework. Here’s a tool to consider:
The ROI matrix
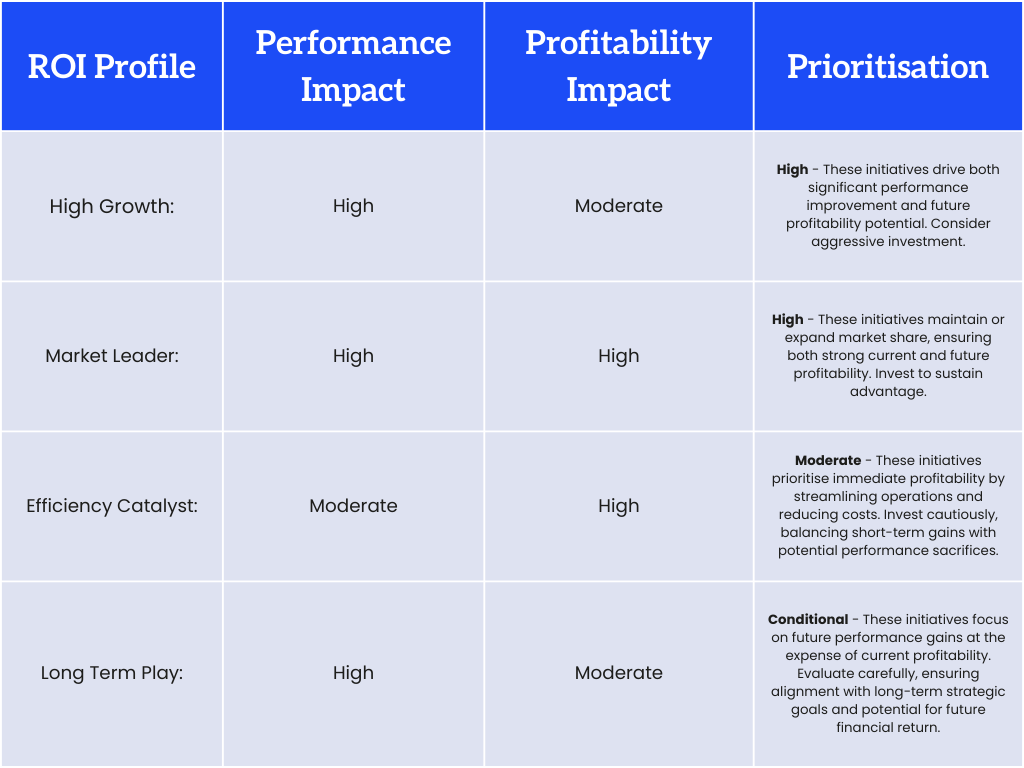
The key to utilising this matrix effectively lies in communication and collaboration. For investments to work, the CFO needs to talk to the head honchos and team leaders. They need to understand what everyone’s aiming for and make sure the money goes towards that goal. By fostering open communication and a shared understanding of the ROI landscape, organisations can:
- Make informed decisions: Balancing performance and profitability considerations leads to a more sustainable and strategically aligned investment portfolio.
- Mitigate potential risks: Open communication helps identify and address potential pitfalls associated with high-performance, low-profitability initiatives.
- Build trust and buy-in: Explain why you’re investing, and people will be more likely to help make it a win.
Great CFOs: Build for the future, not just the bottom line. The ROI Matrix and teamwork are your map and compass for making smart decisions and leading the company to success.
Ways performance management software can help
1. Track Financial Metrics
Performance management software empowers CFOs to build their dashboards and track financial performance in real time. They can see revenue, expenses, profits, and more instantly, allowing them to take quick action. This gives visibility into financial performance and helps quantify ROI across initiatives.
2. Data-driven Decision Making
The analytics and reporting functionality in the software provides data-driven insights into what’s working and what’s not. CFOs can use these to make informed decisions on resource allocation and investments to maximise returns.
3. Model Scenarios
Advanced systems have financial modelling capabilities to forecast revenues, and costs and measure supposed ROI under different scenarios. This allows stress testing strategies before actual spending.
4. Connect Data
Leading platforms integrate financial data with metrics across sales, marketing, HR etc. This connects revenue/costs to underlying performance drivers – helping CFOs correlate ROI with specific activities.
5. Automation
Automated reporting, variance and budget-actual comparisons save significant time for finance teams. This frees up bandwidth to focus on value-add analytics for strategic decision support to optimise financial returns.
Key takeaways: The CFO’s Balancing Act
Determining where and how much to invest presents a complex challenge – one requiring both financial prudence and strategic vision. This is the unique purview of the CFO role.
Imagine a radar chart with different spokes representing different profitability and performance metrics. Balanced scorecards and ROI matrices help finance chiefs fill in all the spokes to get a complete picture of returns. This allows smarter capital allocation aligned with corporate strategy and capabilities.
While maximising immediate earnings presents temptation, the CFO must balance short-term gains against long-term positioning. Ultimately, their financial acumen must serve the overall competition and responsibility of the enterprise.
A well-rounded view of ROI is key for CFOs to win the long game.
 HR Core